We continuously monitor the status of the CCS/RCI cluster resources and all its related services. If there are any interruptions in service, it will be updated here.
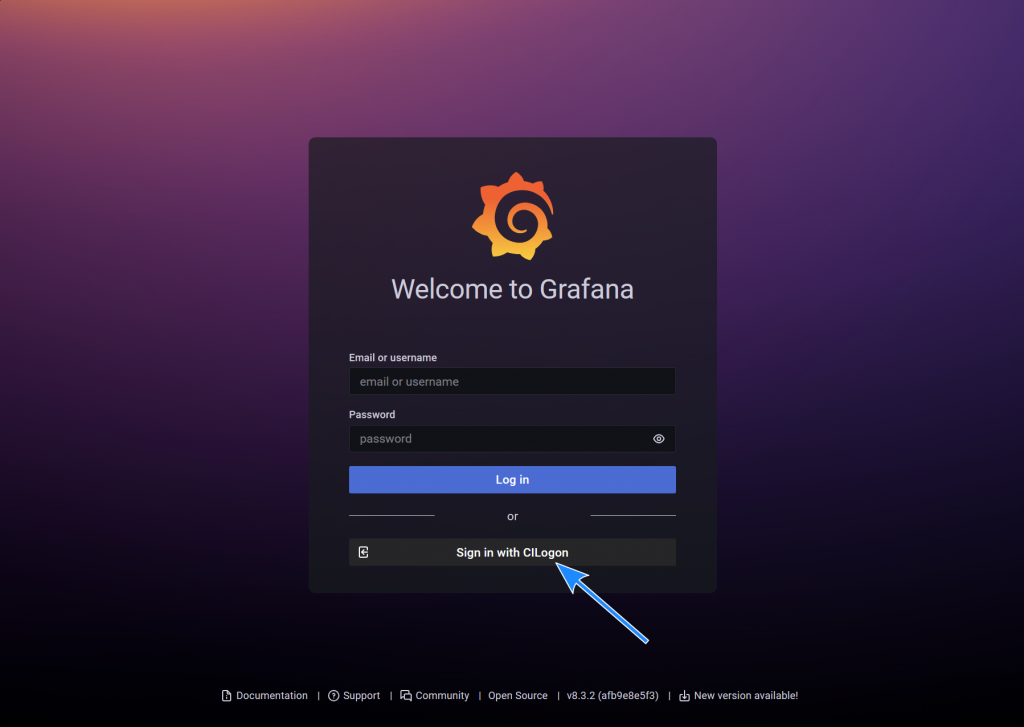
Open a Web browser and visit https://monitor.ccs.uky.edu to view our Grafana dashboards.
Click “Sign in with CILogon”.
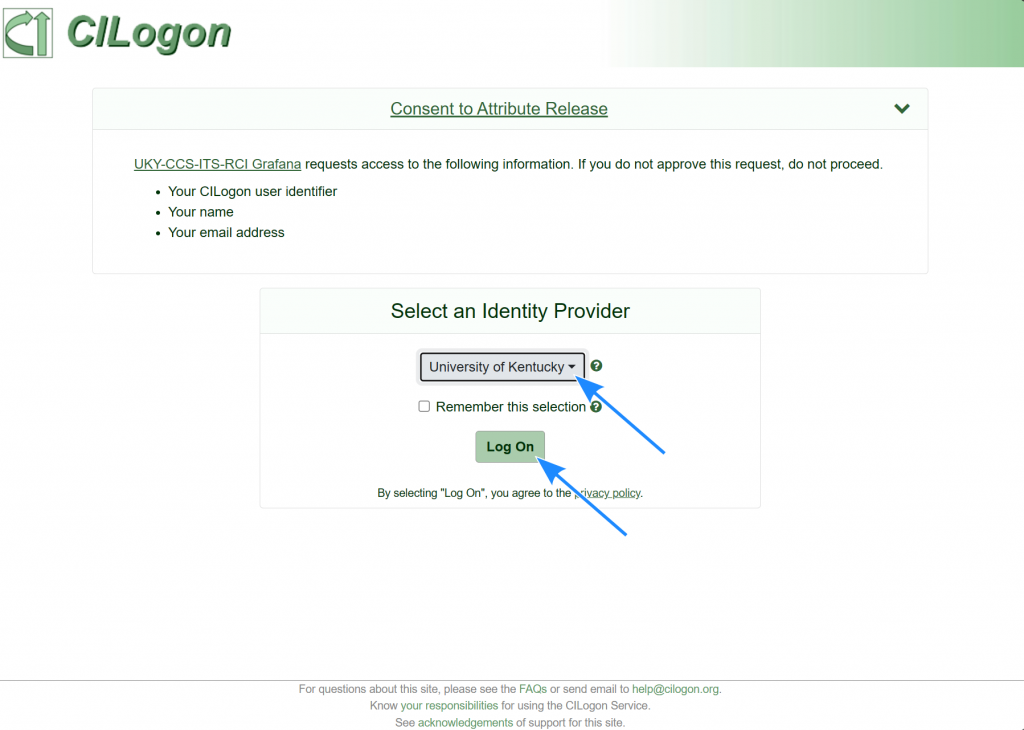
Select “University of Kentucky” from the list and click “Log On”.
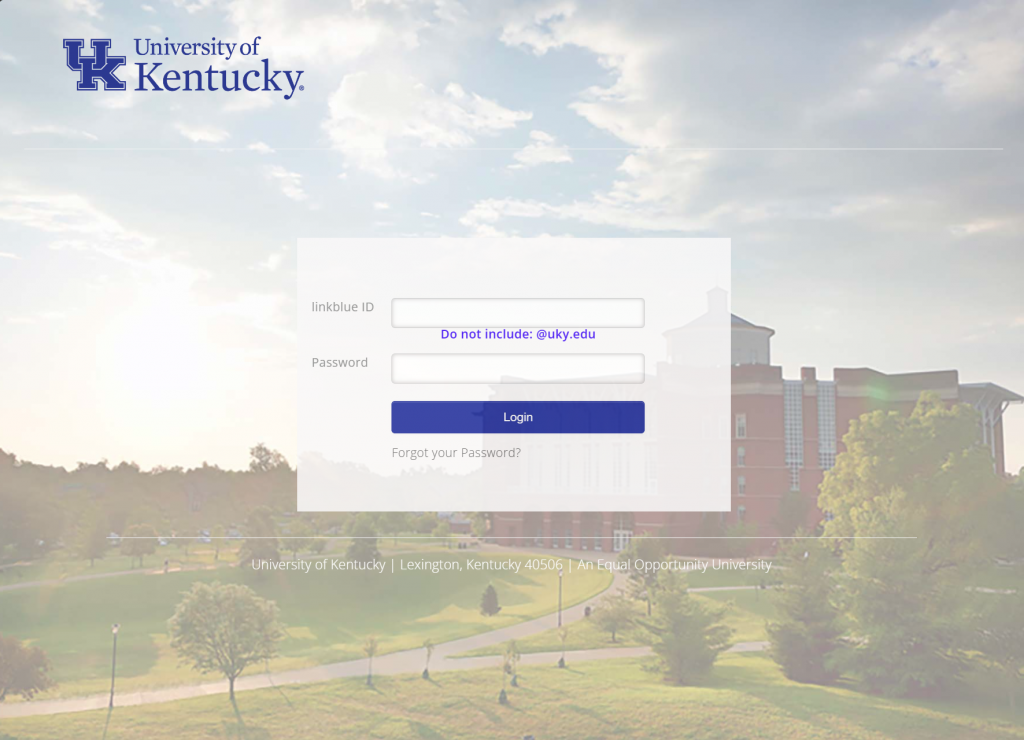
Log in with your Link Blue credentials. (Do not include @uky.edu)
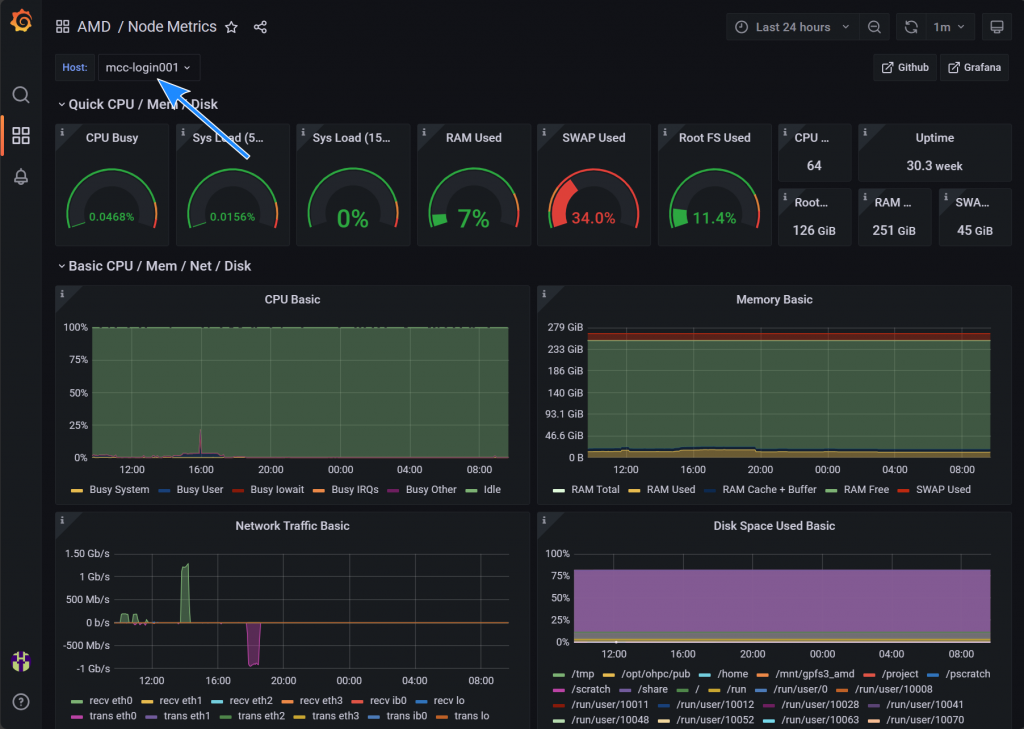
Upon logging in, you will see the Cluster Dashboards. Select Node Metrics for either MCC (left) or LCC (right).
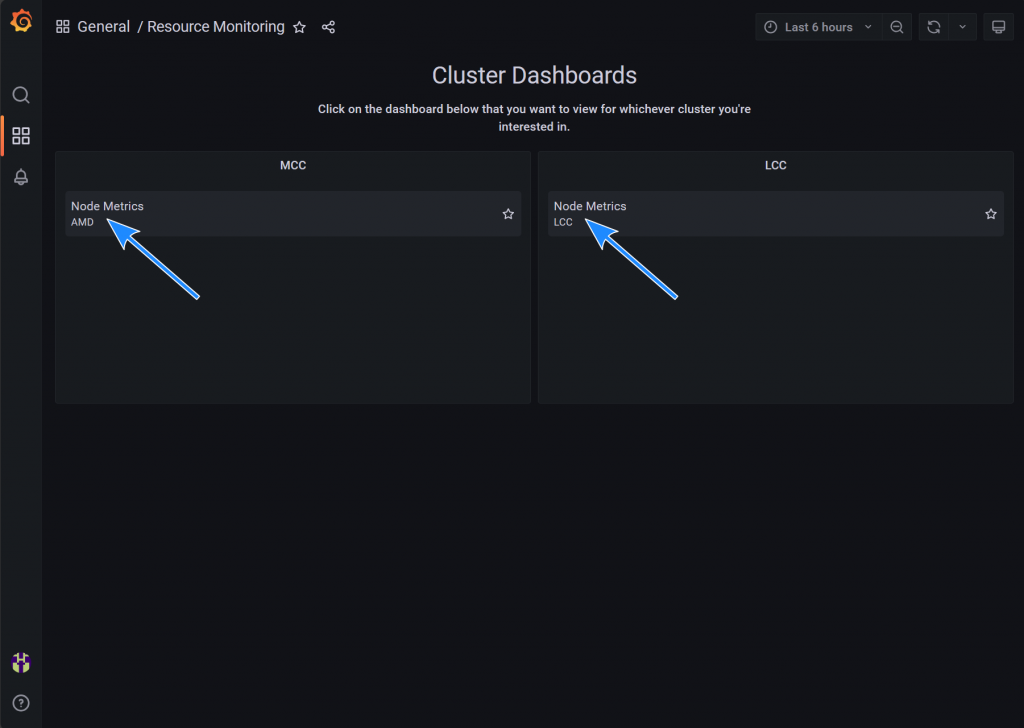
You now see the live statistics from the cluster you selected. You can choose the individual node you would like to monitor from the dropdown box in the top-left corner.